Dynamic Contrast-Enhanced Ultrasound (DCE-US) for Tumour Response
J Fromageau, JC Bamber; in collaboration with N Tunariu, Department of Radiology, Royal Marsden NHS Foundation Trust, and CRUK-EPSRC Cancer Imaging Centre; M Orton, D Collins, CRUK-EPSRC Cancer Imaging Centre.
Source of funding: Royal Marsden NHS Foundation Trust, CRUK, EPSRC, Zonare Medical Systems Inc
Ultrasound (US) contrast agents (gas-filled microbubbles, 1-8 mm diameter, that normally do not extravasate) offer potential for convenient and safely-repeatable evaluation of tumour perfusion. Modern non-linear US pulse sequences and processing provide images in which intensity is directly related to local vascularisation and agent concentration.
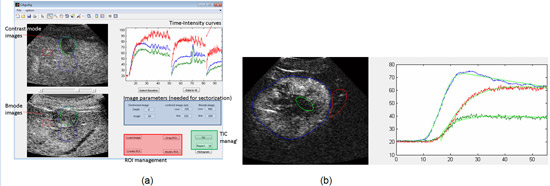
We are developing software with a graphic user interface (Figure 13) to quantify tumour perfusion using dynamic analysis of sequences of raw contrast echo data for assessing tumour response in a clinical trial of a novel antiangiogenic drug. Currently, during the dose escalation phase of the trial, we are taking advantage of lack of response to assess reproducibility and spatial sensitivity of DCE-US methods, and to compare alternative mathematical models used to extract kinetic characteristics from DCE-US echo intensity versus time data. Both contrast bolus arrival and washout, and destruction-reperfusion, are being studied in the same patients. Preliminary results suggest that automatically extracted perfusion characteristics such as peak enhancement, wash-in rate and wash-out rate assessed by DCE-US are sufficiently reproducible to demonstrate spatial homogeneity and temporal invariance when it exists, and yet sensitive enough to detect important differences, such as between tumour, necrosis and adjacent liver.
Four different kinetic models evaluated performed similarly in this respect. The four models differed considerably, however, in their ability to fit the experimental data; two new models (“multi-vessel” and “difference-of-exponentials”) were found to be the most robust. The multi-vessel model, taken from the DCE-MRI literature but not previously used in DCE-US, was also able to distinguish between bolus arrival and reperfusion, whereas the other models could not.
 Fig.13. (a) The appearance of the graphic user interface, which decodes raw contrast files, scan converts them for display and allows the user to explore the sequence, draw multiple regions of interest (ROI), and control kinetic analysis with selection of one of four kinetic models for automatic extraction of kinetic features. (b) Example showing the quality of fit of the multi-vessel model (black) to bolus wash-in data for ROIs drawn to cover the whole tumour (blue), a necrotic region (green), and nearby liver tissue (red).